Debugging Taskflows in WebCenter Spaces

Requirement – Debugging Taskflows in WebCenter Spaces

Solutions-
One way of setting this up is to modify the startManagedWebLogic.sh (linux) that will start Spaces. This script is located in the /user_projects/domains//bin directory.

In the new startManagedWebLogic.sh file locate the section that declares the JAVA_OPTIONS. Modify the startManagedWebLogic.sh file and add the debug java options:

-Xdebug -Xnoagent -Xrunjdwp:transport=dt_socket,address=4000,server=y,suspend=n

to the JAVA_OPTIONS. For example, in my file I added this option in front of the existing option already there:

JAVA_OPTIONS="-Xdebug -Xnoagent -Xrunjdwp:transport=dt_socket,address=4000,server=y,suspend=n 
-Dweblogic.security.SSL.trustedCAKeyStore="/home/oracle/Middleware/wlserver_10.3/server/lib/cacerts" ${JAVA_OPTIONS}"
export JAVA_OPTIONS

Once this is done you will be able to use this script to start Spaces in debug mode. To check to see if the option has been enabled you will see the reference to the debug mode: Listening for transport dt_socket at address: 4000 in the Spaces terminal window.

Configuring JDeveloper

The next step is to enable the remote debugging feature for your project in JDeveloper. To do this, go to your project’s properties. Select the Run/Debug/Profile section, and click the Edit button for the “default” setting. This will bring up a dialog where you can check the Remote Debugging option.

For more information read this

Happy Debugging with Vinay Kumar in techartifact…

Do your Webcenter portal 11.1.1.8 performance analysis

Performance Analysis of a Portal application or any application look tedious and tricky task .Reason portal application consist of various other task flow from different resources.Talking for webcenter portal 11.1.1.8 portal application have awesome feature of performance analysis called Portal Page Performance Analyzer. With WebCenter Portal 11.1.1.8 however, this process becomes extremely simple and efficient.

The portal page analyzer offers a simple way to diagnose slow pages and requires minimal set up or configuration. When this feature is on, the time spent on “high level” page components is calculated and displayed so you can see at a glance which components are slowing down your page. The overall time spent on the page also displays at the top left of the page

portal

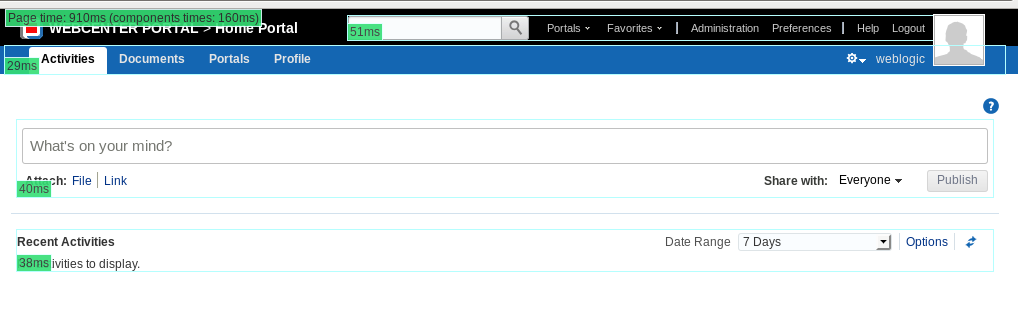
In WebCenter Portal, “high level” page components are wrapped in a ShowDetailFrame so they can be moved, hidden or shown on the page, and edited by Oracle Composer and it is the overall timing for each ShowDetailFrame that displays.Since ShowDetailFrames enclose task flow regions on a page, this feature lets you instrument WebCenter pages on the basis of individual task flows. When enabled, you can visually analyze the performance of every single task flow on the page like this.

This feature is default by default.User have to turn on this feature.

How to enable/turn on this feature – -You can do by MDS customization.you need to update the metadata in webcenter-config.xml using WLST command of exportMetaData/importMetadata.

Steps

-> exportMetadata(application=’webcenter’, server=’WC_Spaces’, toLocation=’/tmp/mydata’, docs=’/oracle/webcenter/webcenterapp/metadata/webcenter-config.xml’)

-> Open webcenter-config.xml exported from MDS in a text editor and set the perfdebug-enabled attribute to true to enable or false to disable this feature.

For example:

<webcenter:perfdebug-enabled>true</webcenter:perfdebug-enabled>

-> Save and close webcenter-config.xml.

-> Import the updated webcenter-config.xml file to MDS.

-> importMetadata(application=’webcenter’, server=’WC_Spaces’, fromLocation=’/tmp/mydata’, docs=’/oracle/webcenter/webcenterapp/metadata/webcenter-config.xml’)

See how to run/excute exportMetaData/importMetadata command or update metadata in webcenter-config.xml

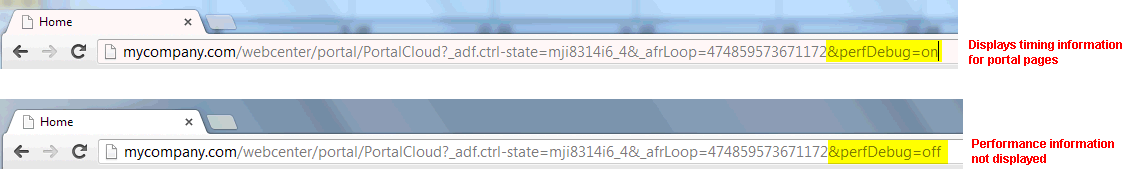
After this- any page in WebCenter Portal 11.1.1.8 can be tested. To test a page, simply append ‘perfDebug=on’ to the end of the URL to the page.

222222

Now you can get information, which task flow, or slow page which create problem.Enter the task flow and page and kill the problem . 😛

Note – The one condition for this method to work, in the Task Flow binding properties, the Task Flow activation should be set to deferred (which is the default in 11.1.1.8).

Hiding Page Timing Information for Your Current Session– set &perfDebug=off in end of url.

Stop displaying page performance information – &perfDebug=off

Happy performance analysis with Vinay Kumar in techartifact….

Jdeveloper internal error- resolve

Today i installed jdev 12 and while deploying i got very weird error like.This solution applicable, whenever you get error related to jdeveloper internal error.

error

I don;t have clue about it.After i dig more into it.Problem is that system11.1.x.x.x folder of jdeveloper.If you installed earlier old version and then you installed new version, sometime it got confused and system folder doesnt rename automaticallyFix for this either you rename the system folder or delete it and restart jdeveloper.

When JDeveloper detects an other system11.x.x.x folder on your system, it asks you if you want to migrate from the other version. In this dialog you can select or search (if you click the magnifying glass) a version to migrate from. You can force the dialog to appear if you start JDeveloper with the option ‘-migrate’ from a command shell.

You should be careful with the migration as it tends to migrate any error too. So if you have to delete the system11.x.x.x folder because of an error, you should first rename the folder, answer the dialog with ‘No’ and see if the problem is solved. Then you can delete the freshly created system11.x.x.x folder and try again with migrating from the renamed folder. If you are lucky the error will not be migrated. After any such action you should check the preferences again, as all changes you made have been erased.

You can get system11.x.x.xfolder path on location in the “Users\AppData\Roaming\JDeveloper\” Folder (windows), as long as you did not specify an other location by changing an environment variable or changing the jdev.boot file.

you can these location in jdeveoper->help->about

about