Many Java static analysis tools exist right there, each one focus on a specific area and has its advantages, we can enumerate:
• Pmd which is a static rule-set based Java source code analyzer that identifies potential problems like:
1. Possible bugs—Empty try/catch/finally/switch blocks.
2. Dead code—Unused local variables, parameters and private methods.
3. Empty if/while statements.
4. Overcomplicated expressions—Unnecessary if statements, for loops that could be while loops.
5. Suboptimal code—Wasteful String/StringBuffer usage.
• FindBugs which looks for bugs in Java code. It uses static analysis to identify hundreds of different potential types of errors in Java programs.
• Checkstyle defines a set of available modules, each of which provides rules checking with a configurable level of strictness (mandatory, optional…). Each rule can raise notifications, warnings, and errors.
Many ways exist to exploit the results of these tools:
• XML format: XML files could be generated from each of these tools, and it can be used to create an HTML report or used by another tool to exploit the analysis result.
• HTML format: HTML report is the prefered way to generate reports and share them between the team, and you can create your custom report by using an xsl stylesheet.
• IDE Plugins: almost all known IDE provides plugins for these tools, which gives the possibility to discover all violations from the source code.
One of the problems with code quality tools is that they tend to overwhelm developers with problems that aren’t really problems — that is, false positives. When false positives occur, developers learn to ignore the output of the tool or abandon it altogether.
And to exploit better their result, it’s better to have a way to focus only on what we want and gives to developers a useful view. In this post we will discover another interesting way to exploit better the result of all known java static analysis tools, and query them like a database.
JArchitect and CQLinq –
JArchitect is another static analysis tool which complements the other tools, it uses a code query langage based on Linq ( CQLinq) to query the code base like a database.
Until JArchitect 3 you can query only analysis data extracted from JArchitect, however the V4 gives the possibility to import the analysis result from many other static analysis tools and query them with CQLinq.
Let’s take as example the source code of the PDT core (the Php plugin for eclipse). and discover how we can exploit the analysis result of these tools from JArchitect.
To begin here are the steps to follows before requesting the analysis result:
• Step1:
Analyse the project with PMD, CPD, FindBugs and CheckStyle. And generate the XML files containing the result.
• Step2:
Analyze the project with JArchitect.
• Step3:
Import all the xml files into JArchitect from the menu “Plugins->Import Plugins Result Files”
JArchitect provides by default many useful queries to request these tools, and all these queries could be customized easily.
Let’s discover some CQLinq queries:
Get all issues:
The request to get all issues is very simple, however as you can see it’s not very interesting, indeed it’s a challenge to exploit a result with 232 725 issues.

To exploit better the result of these tools we can filter it with CQLinq and focus only on what we want.
Request by tool
We can modify the first request and add a criteria about the tool concerned.

Request by ruleset
We can also filter by issue ruleset :

Request by priority
We can also filter by priority:

Most recurrent issues
It’s interesting to know which issues are the most reported by these tools.

Classes having most issues
It’s very interesting to know the classes which contains many violations

As we can observe CheckStyle report thousand of issues and many of them could be ignored.
The previous query is interesting, but it’s not give us exactly the classes with lack of quality, another useful metric to take into account is the NBLinesOfCode, it’s normal that a class with many lines of code contains many issues, for that we can modify the previous request to calculate the ratio between the Issues count and the NBLinesofCode.

What’s very strange in this result is that the ratio of the 8 first classes is more than 200, in this case we have more than 200 issues by code line.
To explain this behavior let’s take a look at some lines of the CompilerAstParser:

The NbLinesOfCode is the number of statements and not the physical lines, and this Class declare many arrays , each one is declared by thousand of physical lines, however each array declaration is considered as one statement.
And as shown before for the most recurrent issues query, the following rule ‘+’ should be on a new line. is violated thousand of times for each array. Maybe it’s better to remove these kind of rules from the CheckStyle configuration file.
Most popular methods having issues
When the static analysis tools report the issues, it’s useful to locate which the prioritary issues to resolve? specially if it concerns bugs.
It’s true that a bug could exist in a specific method, but what interesting to know is how many methods are impacted by the bug, and the popular method are the most used ones and it’s better to resolve them quickly.

Using CQLinq we can combine the result of all these tools and also the result of JArchitect to create more elaborated queries, and add these checks to the build process.
Issues Trend
Having issues in a project is not an exception, we can say that’s normal, however we have to check the quality trend of the project. Indeed it’s a bad indicator if the number of issues grows after changes and evolutions.
JArchitect provides the Trend Monitoring feature to create trend charts. Trend charts are made of trend metrics values logged over time at analysis time. More than 50 trend metrics are available per default and it is easy to create your own trend metrics.
Let’s create a trend metric for the Pmd issues:

And after you can easily create the trend chart to monitor the previous trend metric and add it to the JArchitect dashboard.

With this trend chart we can monitor the evolution of the Pmd issues, and try to understand the reasons when the metric grows over versions.
Customize the JArchitect report
JArchitect make possible to append extra report sections in the HTML report that lists some CQLinq queries.
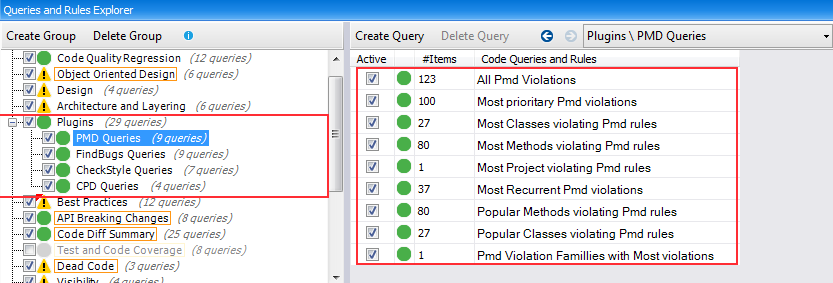
In the CQLinq Query Explorer panel, a particular CQLinq group reported is bordered with an orange rectangle.

You can also add to the report the Pmd trend chart:

And in the HTML report these added sections are accesible from the menu:

And here’s the page added in the report for the Pmd CQLinq queries:

Conclusion
JArchitect 4 is now open to other static analysis tools, and you can also plug your customized tool easily as descibed here. This way you can use all the JArchitect features to exploit better the result from the known java static analysis tools.